Microcharts Integration
One of the main reasons for starting this application project is that I felt it a great candidate to generate sufficient amounts of real-world data that could be used to generate nice graphs of this data over time.
Integration Requirements
- Variable number of charts per ViewModel class instance
- ViewModel property named ChartingData, of type IChartDataPack providing essential data to create data source for Microcharts.Entry type
- View and ViewModel separation of concerns through abstraction of the underlying data source and chart data conversion
- Use Dependency Injection to implement the abstraction for the data source
- Dynamically create and add charts to pages and do so using bindable properties
- Create system flexible enough to use Microcharts, OxyPlot or other charting packages
ViewModel Abstractions
This multiple chart requirement is implemented by first defining what data is required for a chart. A Microcharts chart needs an array of Microcharts.Entry objects that have an underlying float type value, a label value, a value label value and a color value. We don’t want to have things like colors in our ViewModel layer, so we use some value from our ViewModel object that we can use to create a converter class in the View layer that can interpret this value. For instance, we have an Account Register Item Type enumerator property on our Deposit and Withdrawal ViewModel classes. We can use this value to convert to a Green or Red color, but do so in our View layer.
ViewModel Classes for Chart Data
The EasyBudget.Business namespace has an addition. The new EasyBudget.Business.ChartModels namespace has the following classes and interfaces.
IChartDataPack and ChartDataPack
This is the main data type definition for a View Model class’s GetChartData method, or from the View Model class’s ChartData property. It represents a View Model’s collection of chart data.
IChartDataGroup and ChartDataGroup
This data type represents a grouping of data for a single chart. It contains an ICollection<IChartData> property representing the individual data point objects.
IChartData and ChartData
This data type represents a single data point. It contains the value, label, value label and value to use in determining a color in the View.
Binding and Bindable Properties
Binding requires three elements to work correctly. First, it needs a source. This can be any object or property. The next thing it needs is target, but not just any property, it must be a bindable property on an object. Finally, binding requires a path.
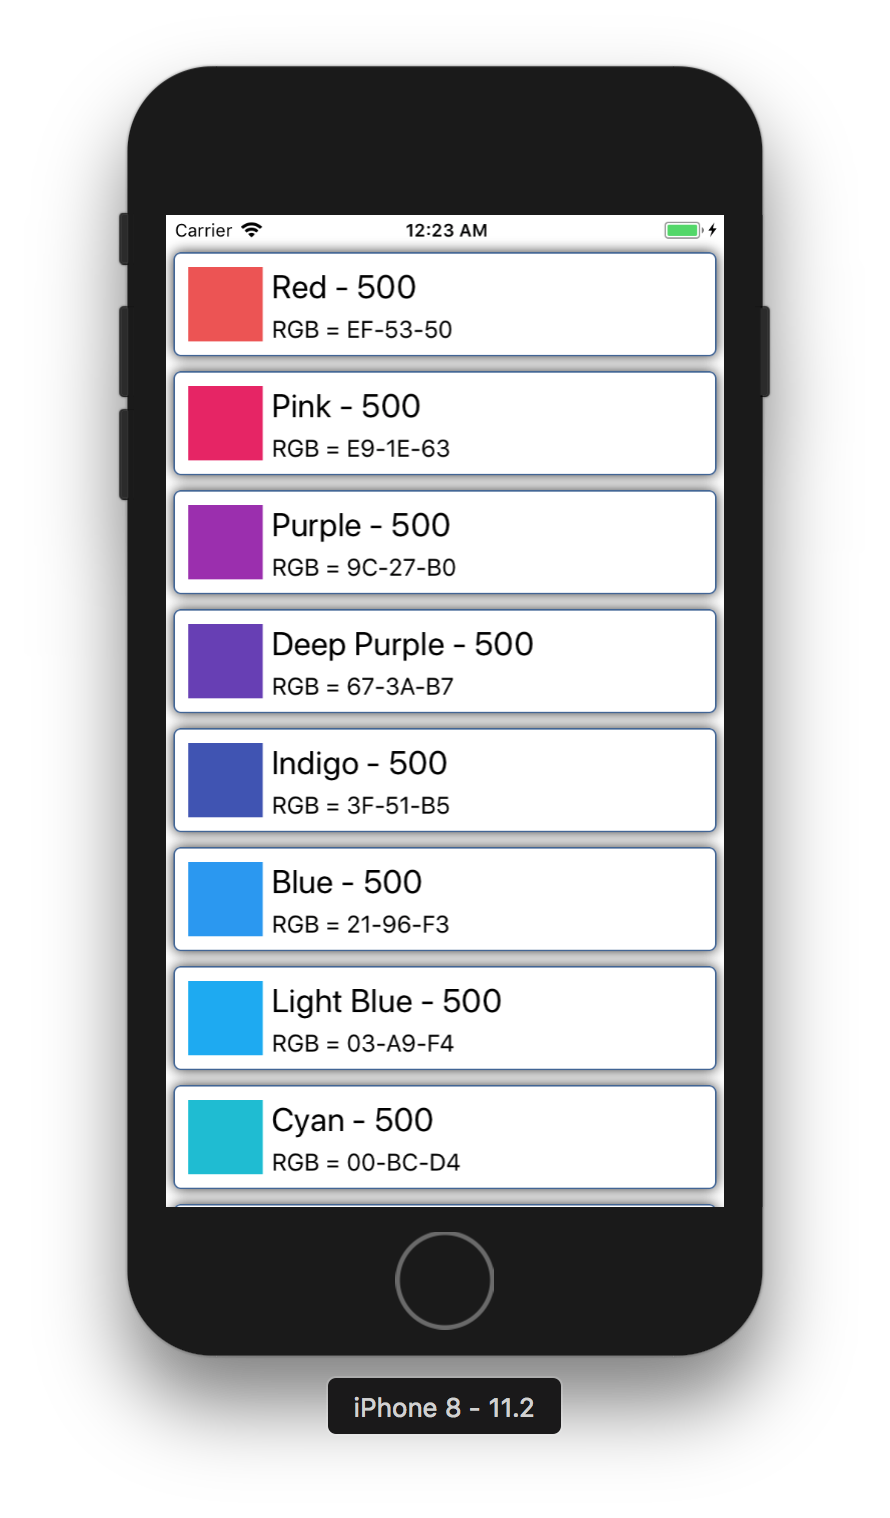
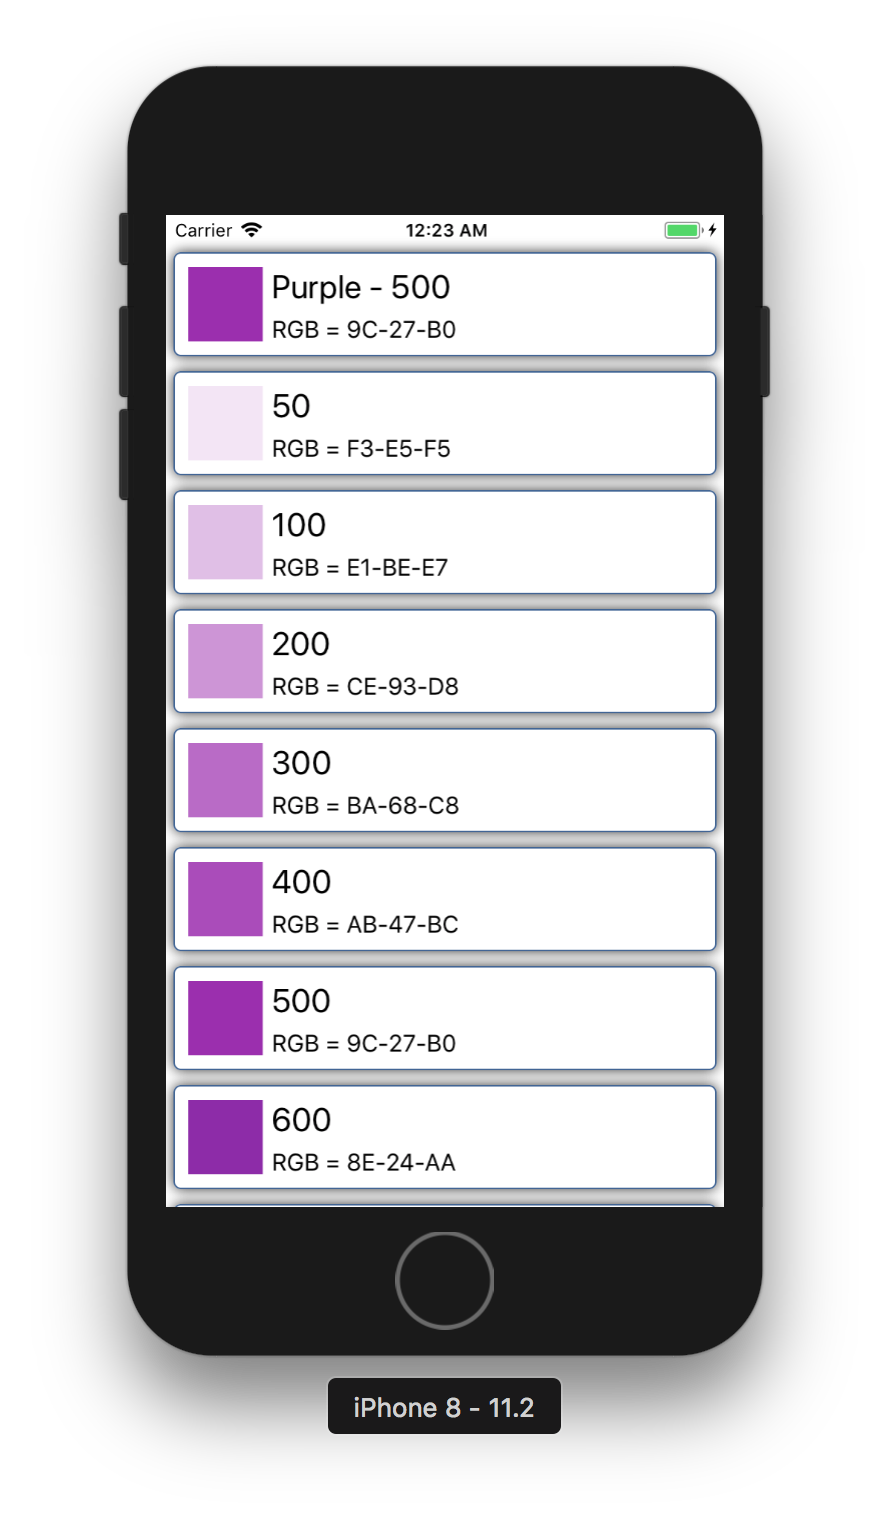
A Color Picker
One of the changes required to accomplish this is to allow the user to select a color for each Budget Category and Budget Category Item. This way, we can associate a specific color code with these records when building a pie chart.
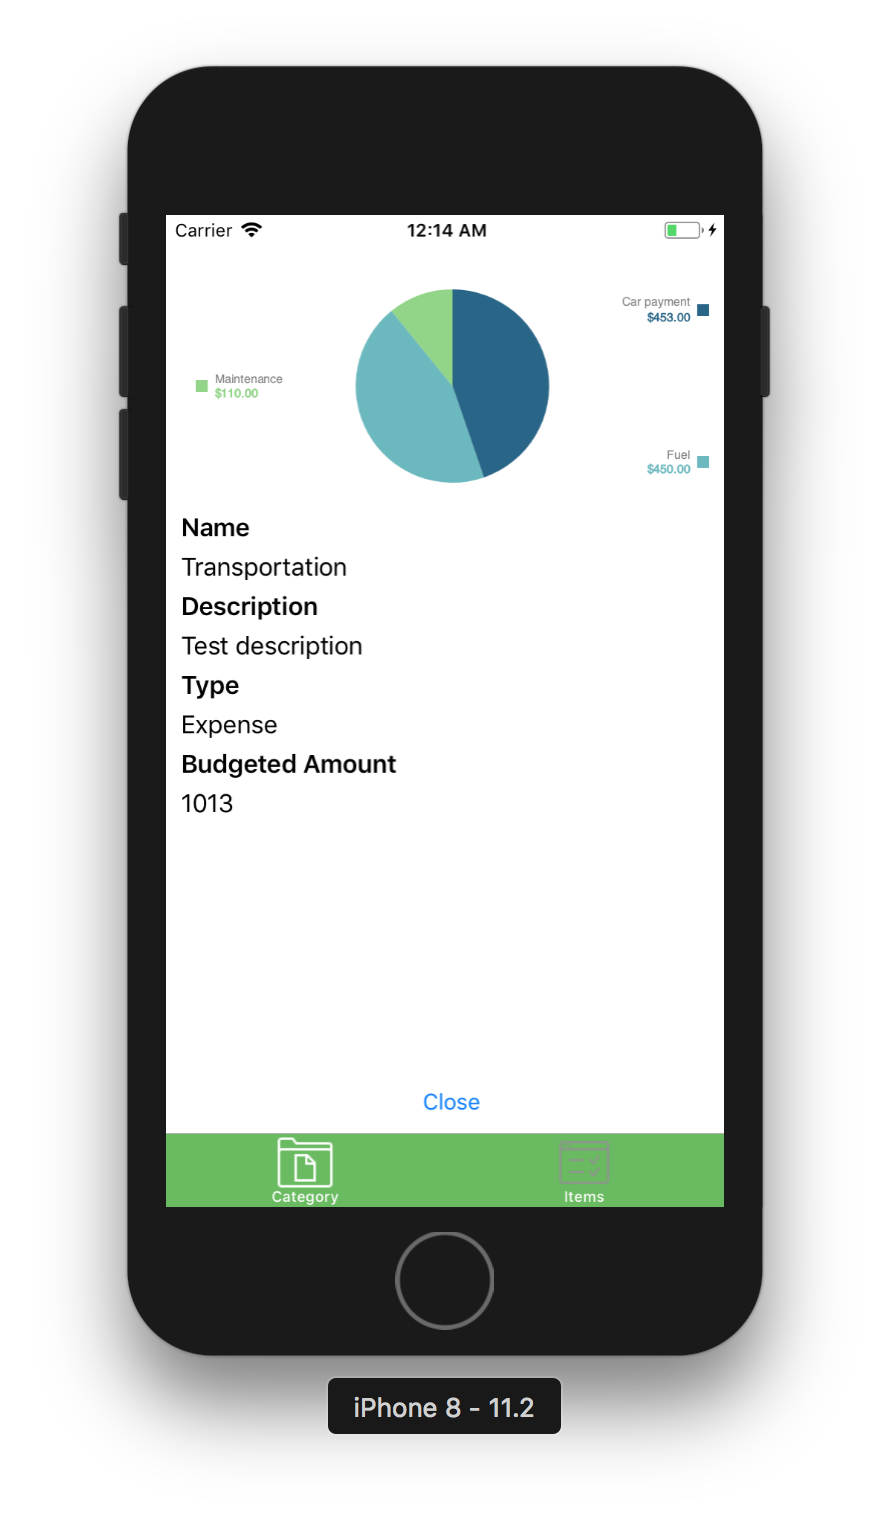
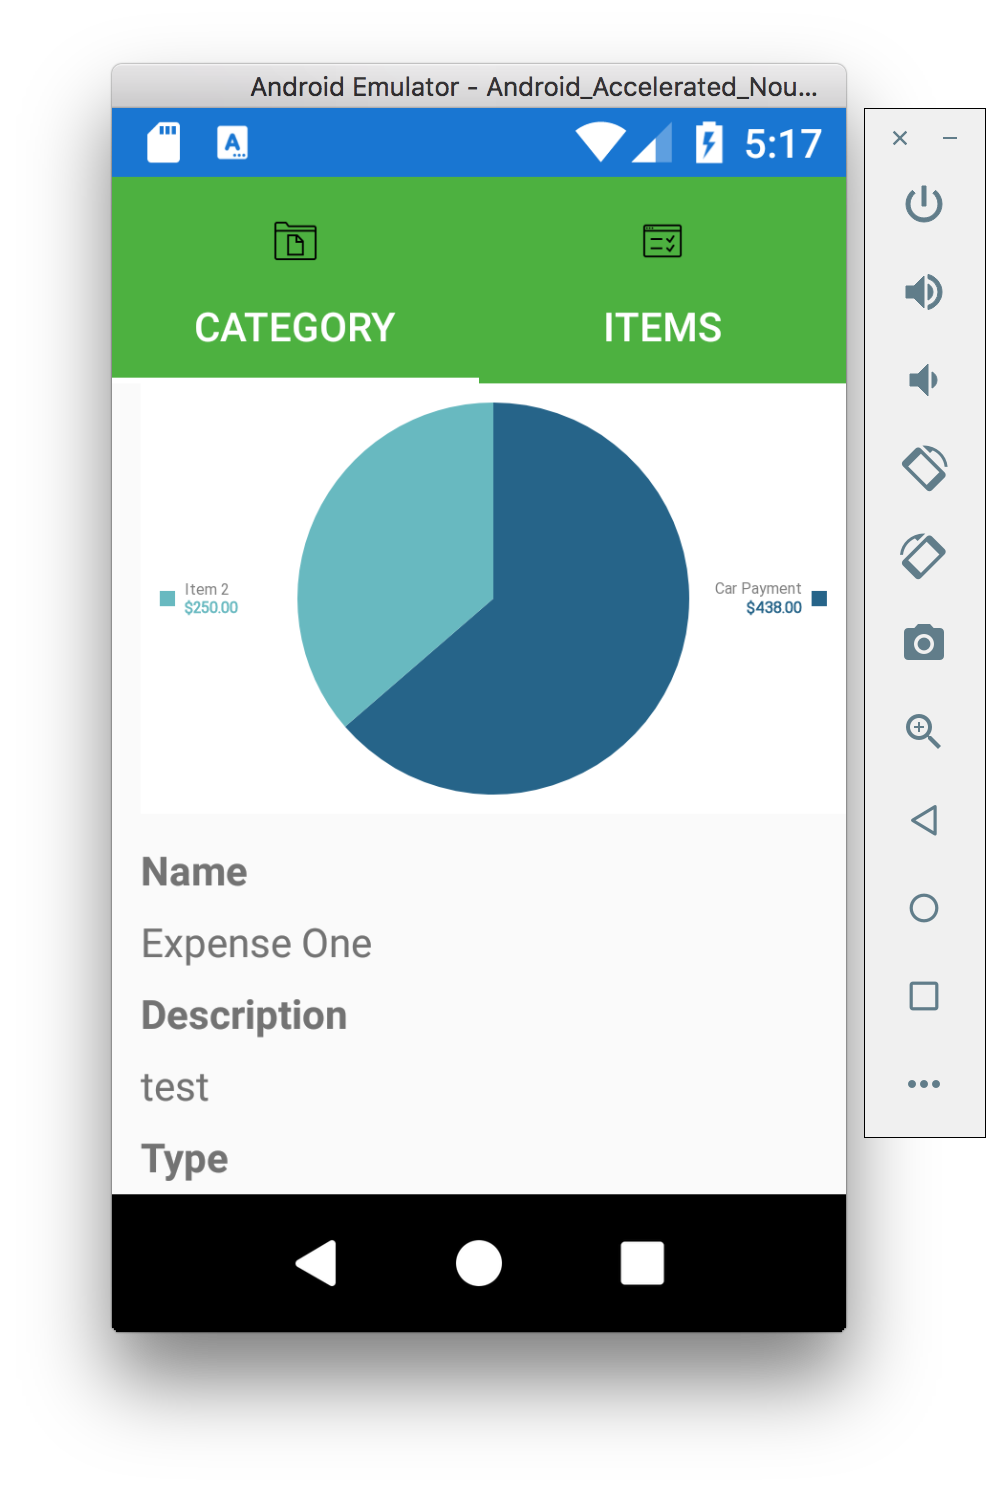
Budget Category View Page
Entry generation occurs in the OnAppearing method of the page. Data is based on data contained in the page’s BindingContext property.