
Charting Package Selection
![]() The EasyBudget project is almost ready to start adding the status page and charts. I was convinced that OxyPlot was the package I wanted to use. It’s Open Source, is relatively easy to use, and produces some nice graphs and charts.
The EasyBudget project is almost ready to start adding the status page and charts. I was convinced that OxyPlot was the package I wanted to use. It’s Open Source, is relatively easy to use, and produces some nice graphs and charts.
This has now officially changed.
Microcharts
I recently read a blog post about a product called Microcharts. It has some very nice looking charts, so I went back and re-evaluated the charting package I want to use.
Here is a look at a pie chart from Microcharts that I incorporated on the Budget Category view page. Implementing the chart was rather straight forward. The only confusing part might be the ambiguous Entry type. The one to use is Mcrocharts.Entry.
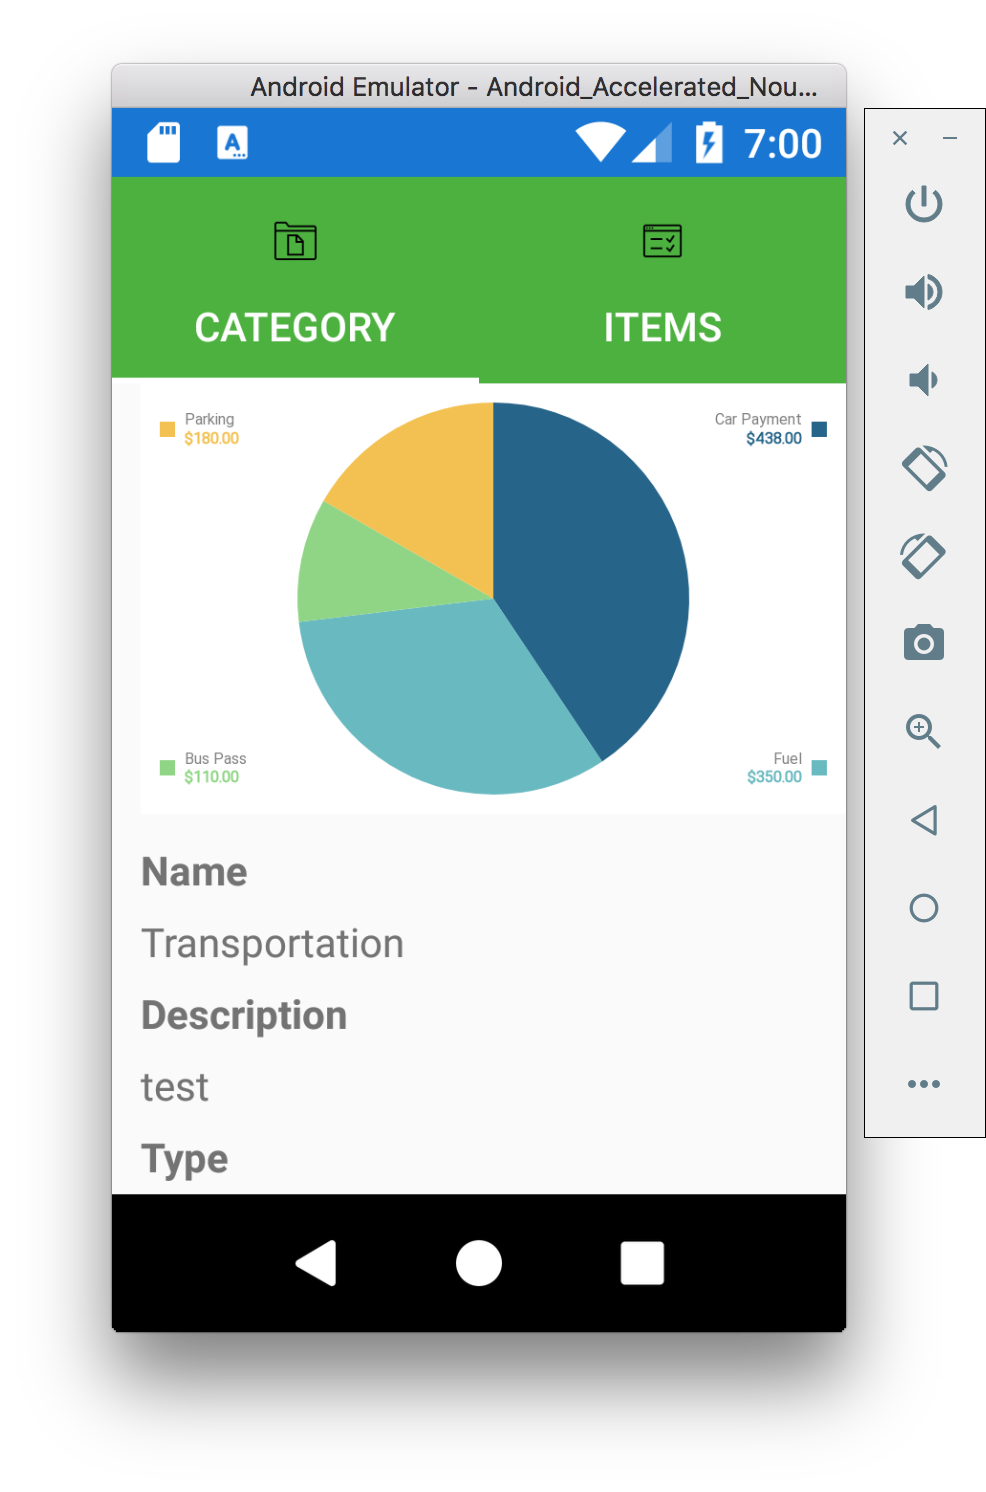
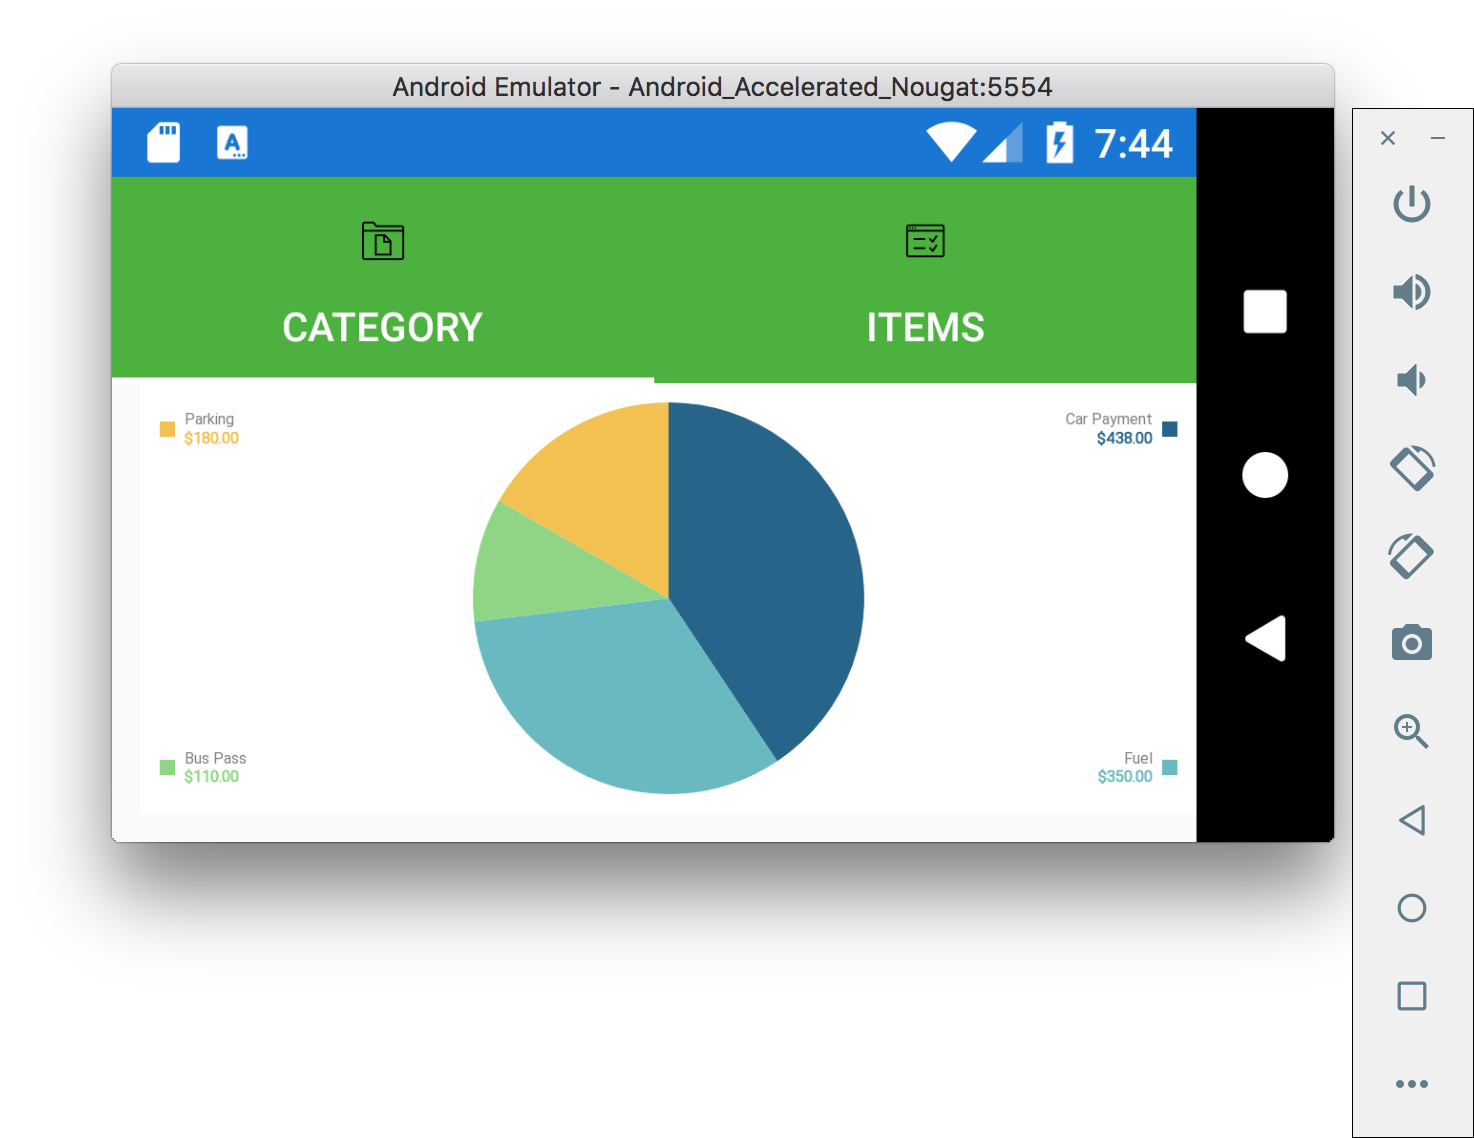
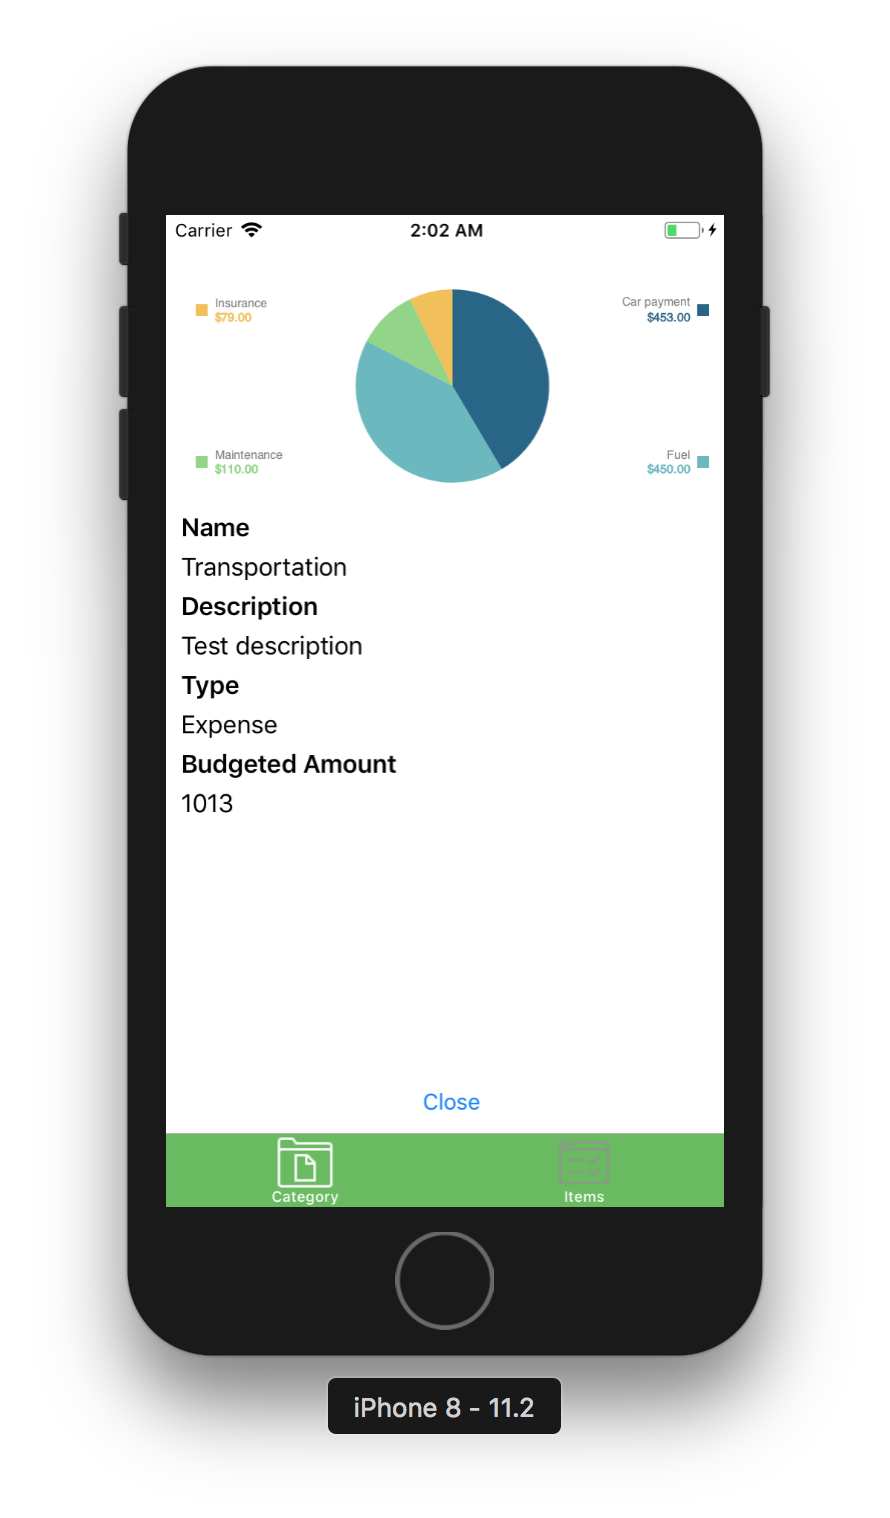
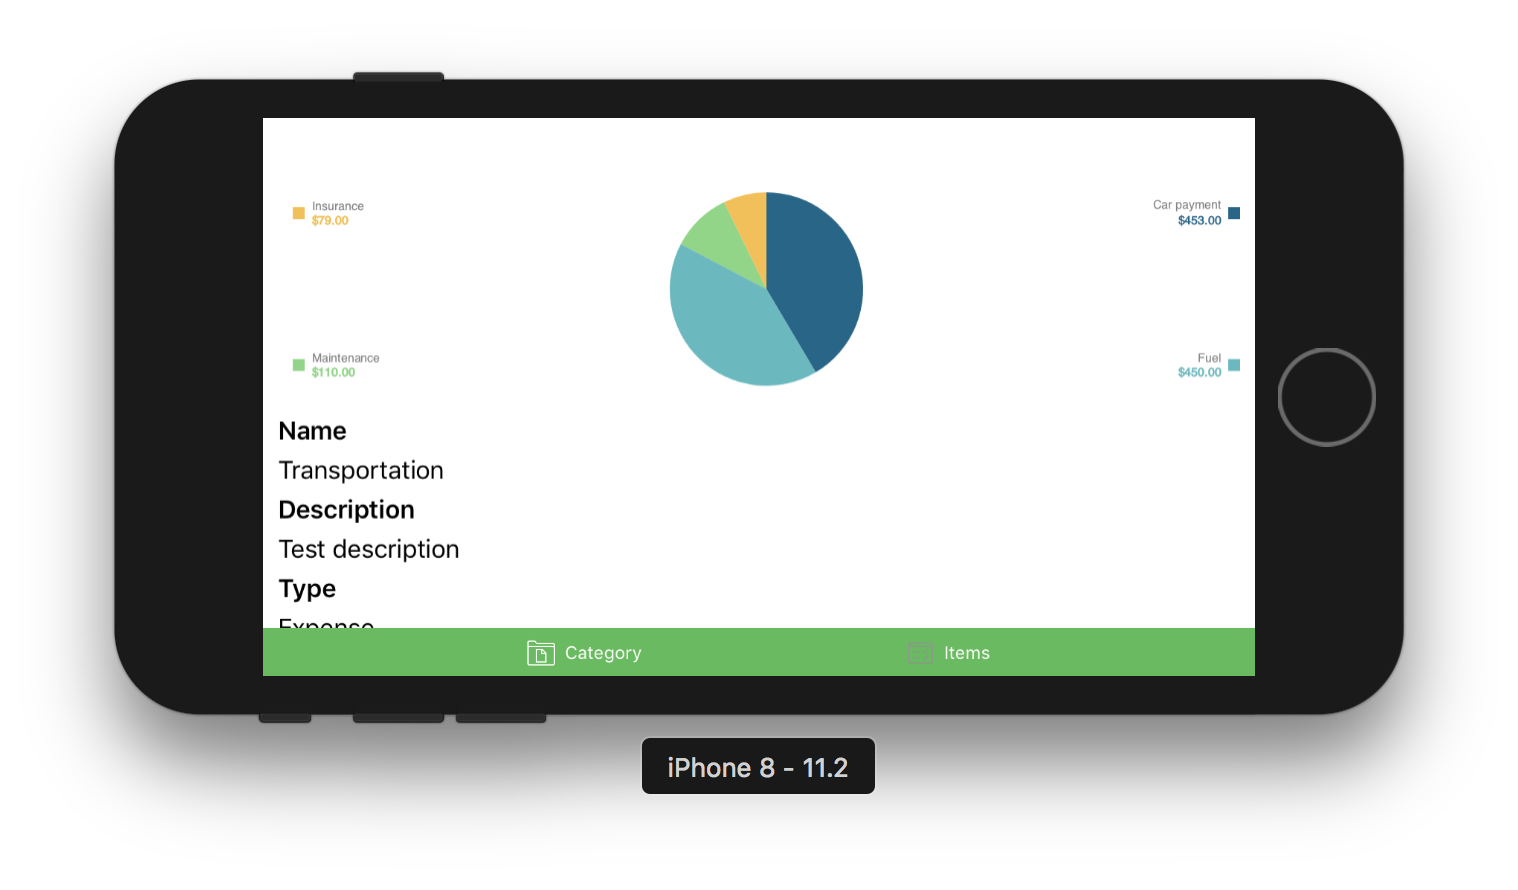
There are a lot of other samples in the Microcharts source.
Project Source Code

The working copy of the EasyBudget source code can be found here.
Next time I hope to have some bar charts in place and more pie charts. Be sure to go to the EasyBudget Project page for the latest roadmap updates, and to the Developer’s Notebook for implementation and design notes.
Until next time,
Charlie