
First, a word about Design Patterns
EasyBudget adheres to a fairly strict MVVM design pattern. That is to say that EasyBudget has a layer of separation between the actual data layer, or Model and the User Interface, or View. The layer separating the View from the Model is our business layer, or ViewModel layer as it applies to the MVVM design pattern.
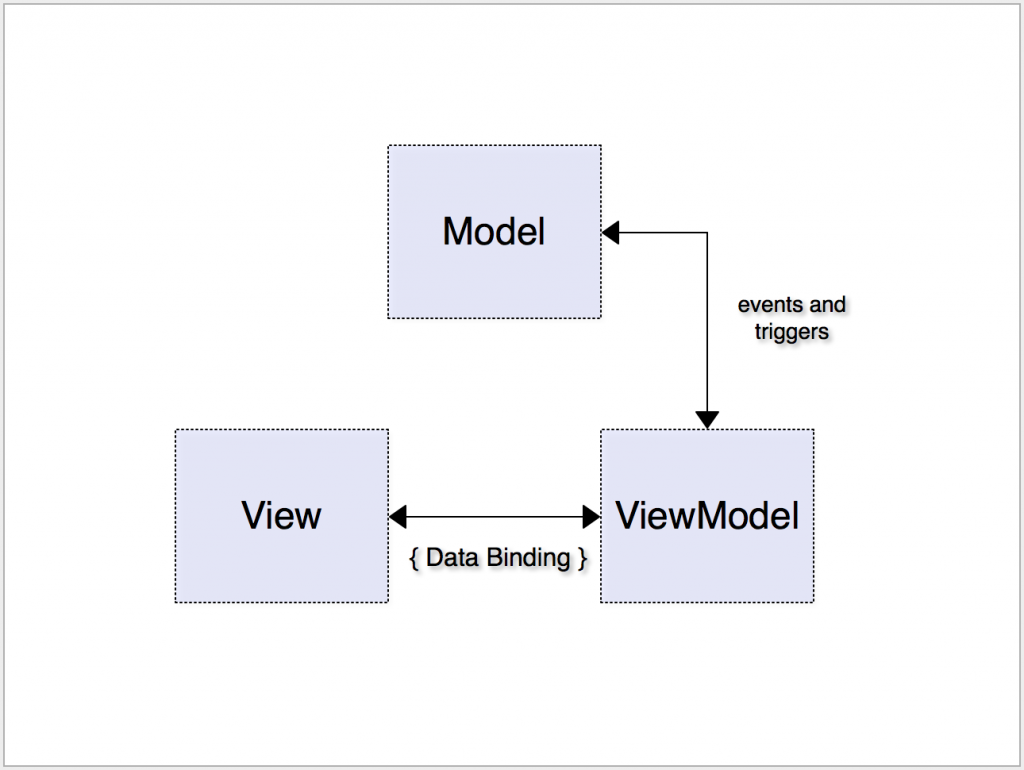
With a charting package such as Microcharts, we have a package that is pretty much View layer exclusive. Ideally, our View Model classes will not know about Microcharts, because it it not the View Model’s responsibility to know about a View component.
This means that we need expose enough data in our View Model so our View knows how to actually construct our chart objects. Separating functionality in an application is always a good thing as it helps organize code, makes code more flexible and extendable, and greatly increases code testability.
So, my goals with this are
- Integrate great looking charts into EasyBudget
- Create a variable number of charts per page based on the underlying ViewModel’s ChartingData property
- Completely separate out business logic from the View layer
- Use Dependency Injection to implement the abstraction for the data source
- Create a ViewModel’s ChartingData property to use in dynamically building and adding chart objects to the View page
- Bind a chart to an underlying data source to automatically update the chart based on the underlying source data
- Create system flexible enough to use Microcharts, OxyPlot or other charting packages
ViewModel Property for Charting Data
The Developer’s Notebook for this project contains more detailed information about the design specifics, but essentially, I created a property on the base View Model class that returns the data necessary for the View Layer to construct the data of the correct type used for a group of charts associated with the View Model instance.
Binding and Bindable Properties
Currently, I have a chart provider class that builds chart entry objects for a chart, selects the chart type based on the source of the chart data, and returns a chart object to the calling class. At the moment, this occurs in the OnAppearing override for the XAML page being loaded and this works enough to satisfy the underlying reasons for binding the chart to the View Model data. The charts are generated each time the page is displayed, which also corresponds to when a View Model is loaded, so the charts remain current with updated data.
The addition of color and color selection have introduced another aspect of XAML control binding and view models, and that is Item Value Converters. I have created a few of them to aid in converting data from our View Model layer and changing it to better suit values required in the View layer. Binding can be greatly aided by the use of custom converters, but a few default converters already exist.
Colors
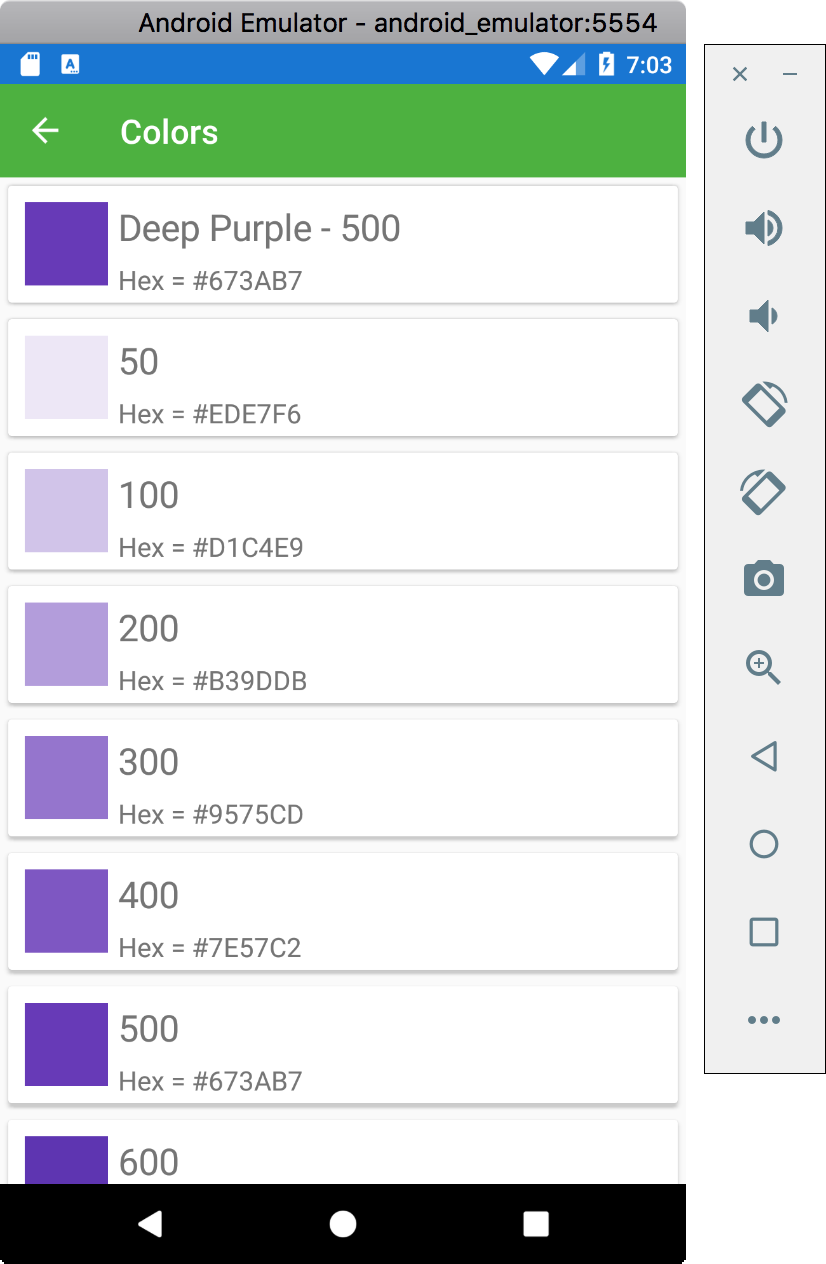
Colors are an important component to data visualization, so it stands to reason that each model object should have some type of identifiable color association, or at least the user should be able to select colors from a broad color palette. Colors help identify slices of a pie chart when there is a list of items also displayed that have the same color association.
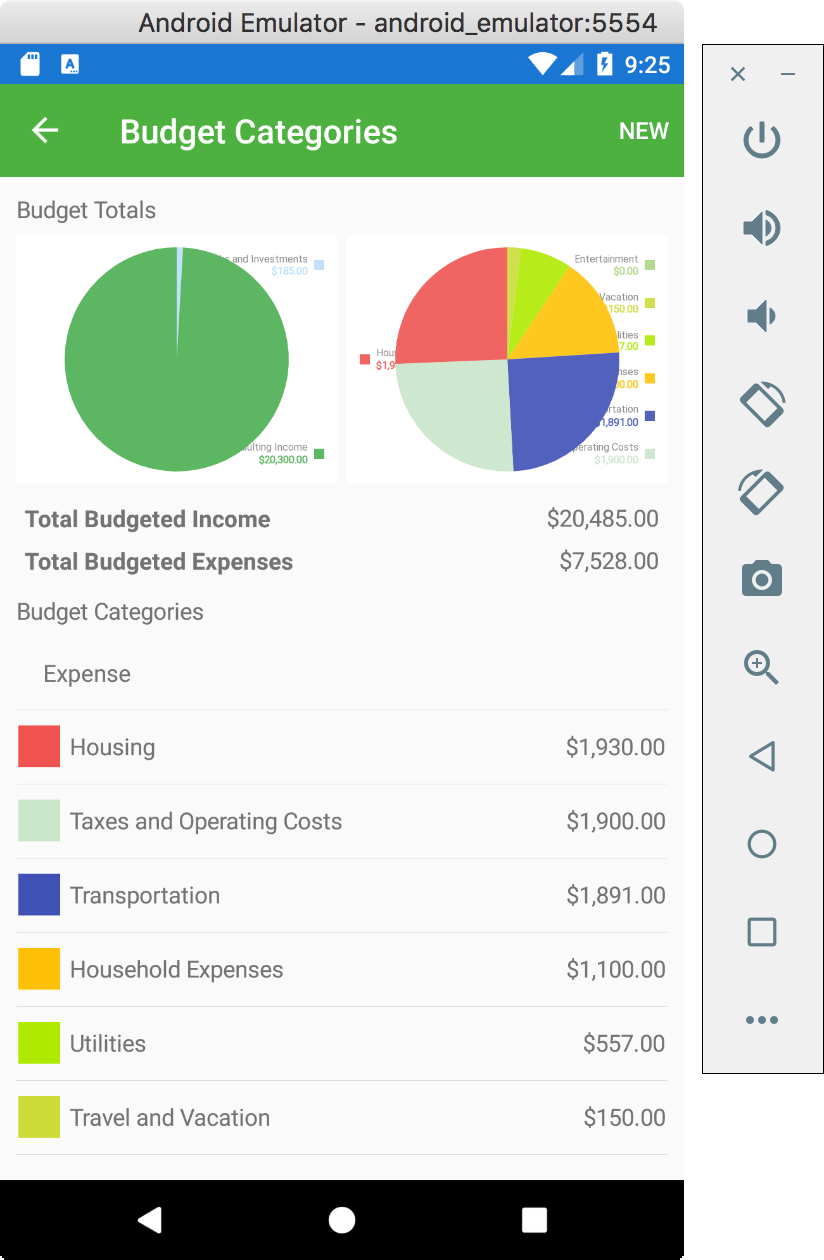
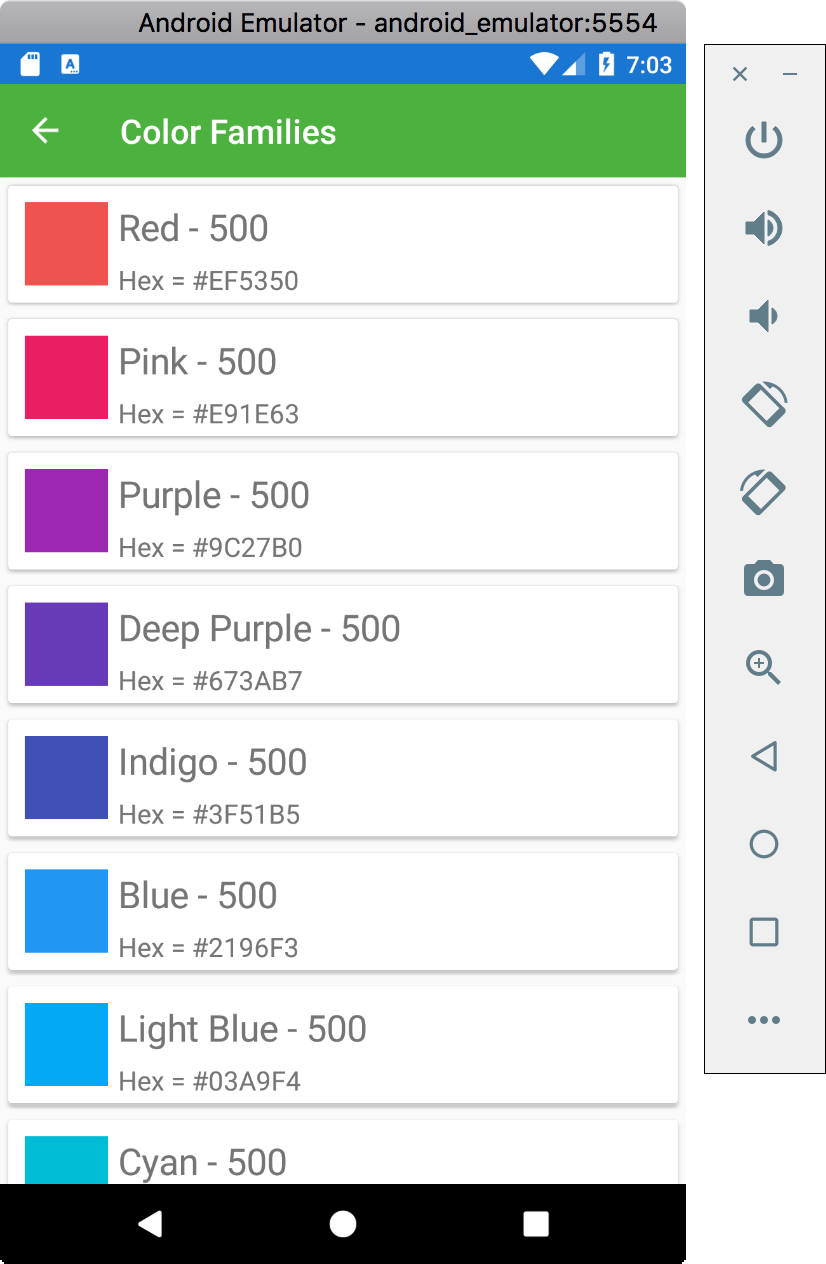
To allow for this, I needed to create a color selection tool that would display multiple color palettes and multiple shades of each color. What I came up with is a ListView control having a static list of color palettes or families, and when a color palette is tapped, a second screen is shown that displays the various shades of colors in the selected color family.
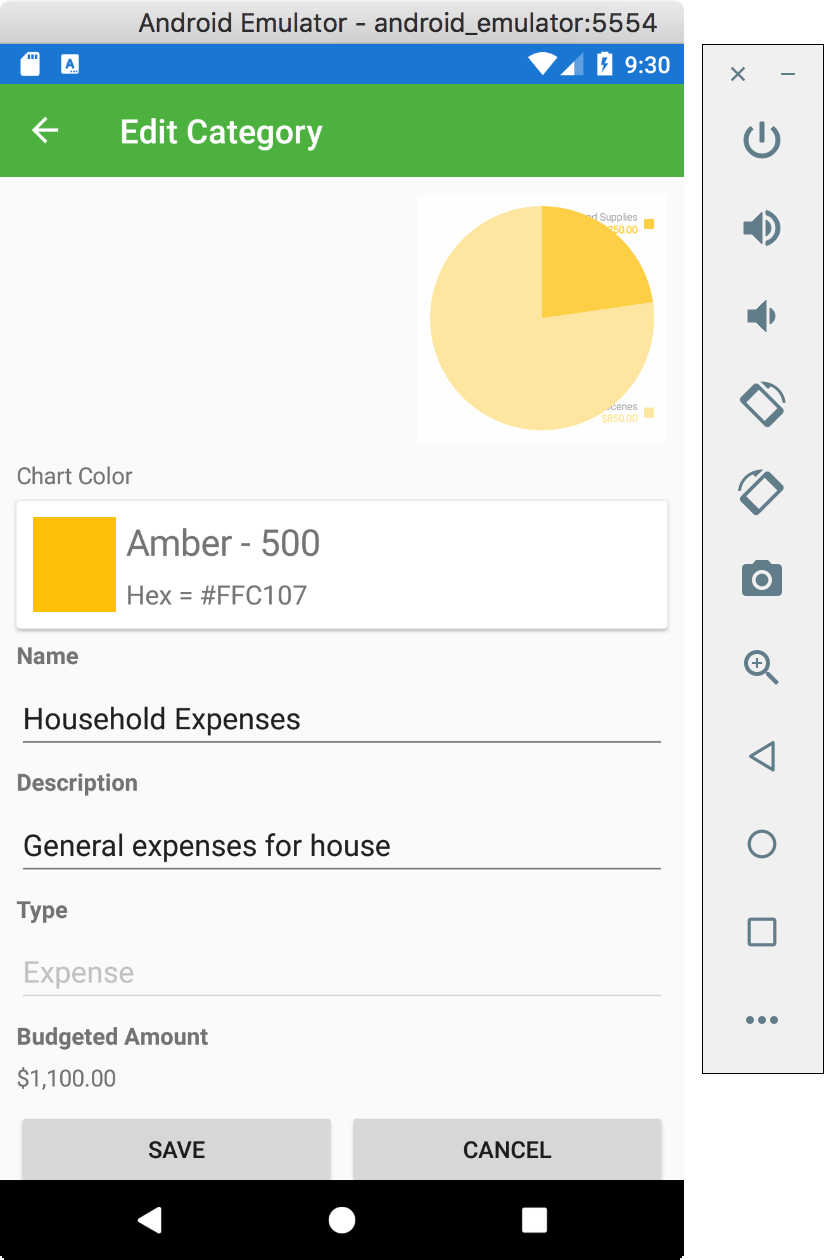
This works out rather nicely and was incorporated into the Budget Category and Budget Item Edit pages. The related View pages also display the configured color, but users can only edit the color from the Edit pages.
Other Charting Packages
I have built the system with flexibility in mind. While not exactly interchangeable, I have built a system that can be extended to other packages such as OxyPlot by adding another chart provider class that uses the same Interface, then registering that provider in the Dependency Injection container instead of the Microcharts provider I currently use.
Project Source Code

The working copy of the EasyBudget source code can be found here.
Be sure to check out the project page for updates as the project progresses and the Developer’s Notebook for some detailed project design notes.